


| Top Forex Brokers |
|---|

|

|
| Best Social Trading |
|---|

|
Browse Categories
Pivot Breakout Strategy Explained
How to Trade Forex Using the Pivot Breakout Strategy
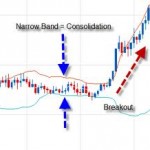
 One of my favourite forex trades is when I am able to profit from a cool and sustained breakout. Breakouts occur after moments of consolidation. Whenever I see an area of consolidation on the charts, it is a signal that something big is about to happen. However, it is not always easy to spot periods of consolidation, especially when you are using short term charts for your analysis. This is because a period of consolidation on a daily chart for example, may not seem as such when you use a 1 hour chart. This is where pivot points, which in themselves mark boundaries for prices, come in very handy.
Pivot points are used to show the areas at which traders are likely to sell (resistance) and areas at which traders are likely to buy (support) a currency. They provide boundaries which restrict the price action, as long as the boundaries are not broken. For the breakout trade, we want to trade a situation where the stimulus for price movement is so strong, that a tendency by traders to reverse the price action at the boundaries is soundly defeated.
Before we get into detail I want to recommend a proper and reliable broker where you can work on your breakout strategy: Plus500. In case you are not already registered there, I highly suggest you will do it now and try this strategy in practice (with their free demo account).
Sign up to Plus500.com and get started at this CFD broker!
Trading Process
The starting point of the breakout trade is to locate the pivot points. Some do this manually, but the easiest way to do this is to download an automatic pivot point calculator online for free, and save this in the custom indicator folder of your MT4 client. The indicator is now attached to the chart of the currency we want to analyze. The pivot points will show as seen on the diagram.
The next step is to determine the market sentiment for the day. The position of the market open relative to the central pivot point is used for this determination. A market open price that is higher than the central pivot point indicates a bullish sentiment. A lower market open relative to the central pivot gives us a bearish bias.
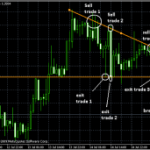
The chart below is a 4hr chart showing our breakout trade. The pivot points showing the support and resistance levels as well as the central pivot which is key to this strategy are shown and the various lines are colour-coded.
The opening price at 0000GMT on 01/06/2011 was 1.4344. This price was 32 pips higher than the central pivot point at 1.4312, giving us a bullish market bias for the day. A further confirmation that this was going to be the day of the bulls was from the candlestick that formed at the market open. The hammer is a bullish reversal candlestick.

How to Trade a Breakout Using Pivot Points:
Key points in a breakout trade are as follows:
1) A true breakout occurs if the breakout candle closes above the resistance line for a bullish trade, or below the support line for a bearish trade opportunity. This needs to be kept in view when setting profit targets so your unrealized profits are not taken out by retreating prices.
2) Bullish trades are taken “on the bounce”. This means that a minor retracement to the nearest support after a break of the resistance line is a good point at which to re-enter (for traders who had cashed out earlier positions) or a place to pick up the crumbs that are still available in the market.
Following these principles, we can take home three trade scenarios from the chart:
a) The trader can make a market Buy entry at the central pivot point, with a target of the next resistance at R1. This is a trade that would have yielded at least 80 pips.
b) The trader can also take a Buy Limit trade, with the order being placed at R1 AFTER the trade has broken out of R1. This is for the late comers to the table.
c) A riskier trade, which is to place a Buy Stop set to 20 pips above R2, with R3 as a target, an be taken. However it is imperative that the trader ensures that there is enough momentum to support such a trade, so that the trade does not trigger the entry only to retreat downwards.
At every stage, stop losses should be set below the nearest support points so that a retreating price will be checked by a support pivot point.


Have you Tried Binary Options Trading Yet?
 Binary Options trading is one of the newest forms of trading to hit the markets. Binary options allows you to trade currencies, stocks or indices with fixed odds. For more information visit our recommended broker now: