


| Top Forex Brokers |
|---|

|

|
| Best Social Trading |
|---|

|
Browse Categories
Gartley Trading Pattern Strategy – Part 2
A Forex Strategy Using the Gartley Patterns – 2
In the previous blog post, we mentioned the role of H.M Gartley in shaping the way the forex market can be traded using price retracements, as defined in his 1935 book titled: Profits in the Stock Market. In his book, Gartley proposed a method of technical analysis that used repetitive price retracements as the basis of future currency price action.
As the analysis patterns were plotted on a chart, they formed what came to be known as the Gartley pattern. Two forms of this pattern exist: the bullish and bearish variety. Having discussed the bearish variety in part 1 of this piece, we will now deal with the bullish variety of the Gartley pattern.
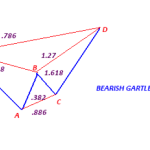
The bullish Gartley pattern is an uptrend trade strategy. The bullish Gartley pattern uses retracing prices as the basis of determining when a downward retracement ends and proceeds in the original uptrend direction. The image below is a simple representation of this chart pattern.
 A look at the pattern shows that it is the direct opposite of the bearish Gartley pattern. The price action of the currency pair is likely to shoot upwards from point D, after the X-D retracement is complete.
The bullish XABCD pattern forms an inverted “W” pattern. The pattern begins at X, moves up to A, then makes a short trip to point B, then up to C, down to the critical point D before the price action makes a full bullish continuation of the previous trend. Point C may or may not be on the same horizontal level as A.
The bullish Gartley pattern is used to determine when to enter a long position following a mild bearish retracement. The entry is made at point D.
The chart below shows a classical bullish Gartley pattern. Rarely will you see the characteristic inverted W form as well as it did on this chart of the AUDUSD. If you see this occurring as clearly as it did, then you are in for a very sweet ride.

BULLISH GARTLEY PATTERN
On the left side of the chart, we see that the price is heading upwards, and the X-A line formed between 17th June and 9th July, 2004. This was followed by a short downward retracement from A – B. Price movements served to complete the Gartley inverted “W” pattern up to point D, from where the price of AUDUSD took off in a 1,000 pip move northwards.
The bullish Gartley pattern is identified by drawing lines that connect the points marked XACD. This resembles a polygonal shape when the lines are connected, starting from the point marked X, and tracing the inverted “W” pattern from points A, B, C and then D. Point D is critical; it marks the entry point for a buy order so as to catch the full bullish continuation after the brief retracement.
Trading with the Bullish Gartley Pattern
The key in using the bullish Gartley pattern as a forex trading strategy is to follow these steps:
1) Identifying the characteristic inverted “W” shape.
2) Connecting the lines correctly.
3) Identifying the point D
4) Buying at point D.
A key step in identification of the Gartley pattern is to trace the price from X to A to D. This A-D swing should correspond to the 61.8% price retracement of the price swing from X to A, occurring within the XABCD Gartley pattern. To do this, the Fibonacci retracement tool can be deployed from X to A. Once the 61.8% Fibonacci level has been visualized, trace the W pattern by plotting lines that run from A to B to C and D. Point D should be at the Fibonacci 61.8% point.
Do not wait until the entire pattern has formed before you start to do your line traces; you will be too late in catching the signal. Rather, trace the lines as the candles form them, using the outlines described for the bearish Gartley pattern.
Once more, this is a very easy forex trading strategy to master without having to get yourself in a puddle of confusion by pasting indicators all over the place.
The key to success in forex is keeping it simple. So keep it simple with the bullish Gartley pattern.

Have you Tried Binary Options Trading Yet?
 Binary Options trading is one of the newest forms of trading to hit the markets. Binary options allows you to trade currencies, stocks or indices with fixed odds. For more information visit our recommended broker now: